Ripes Processor View
Ripes’ Processor view is the key interface for observing pipeline behavior. It shows the datapath, registers, pipeline registers, control signals, and instruction memory for the current cycle.
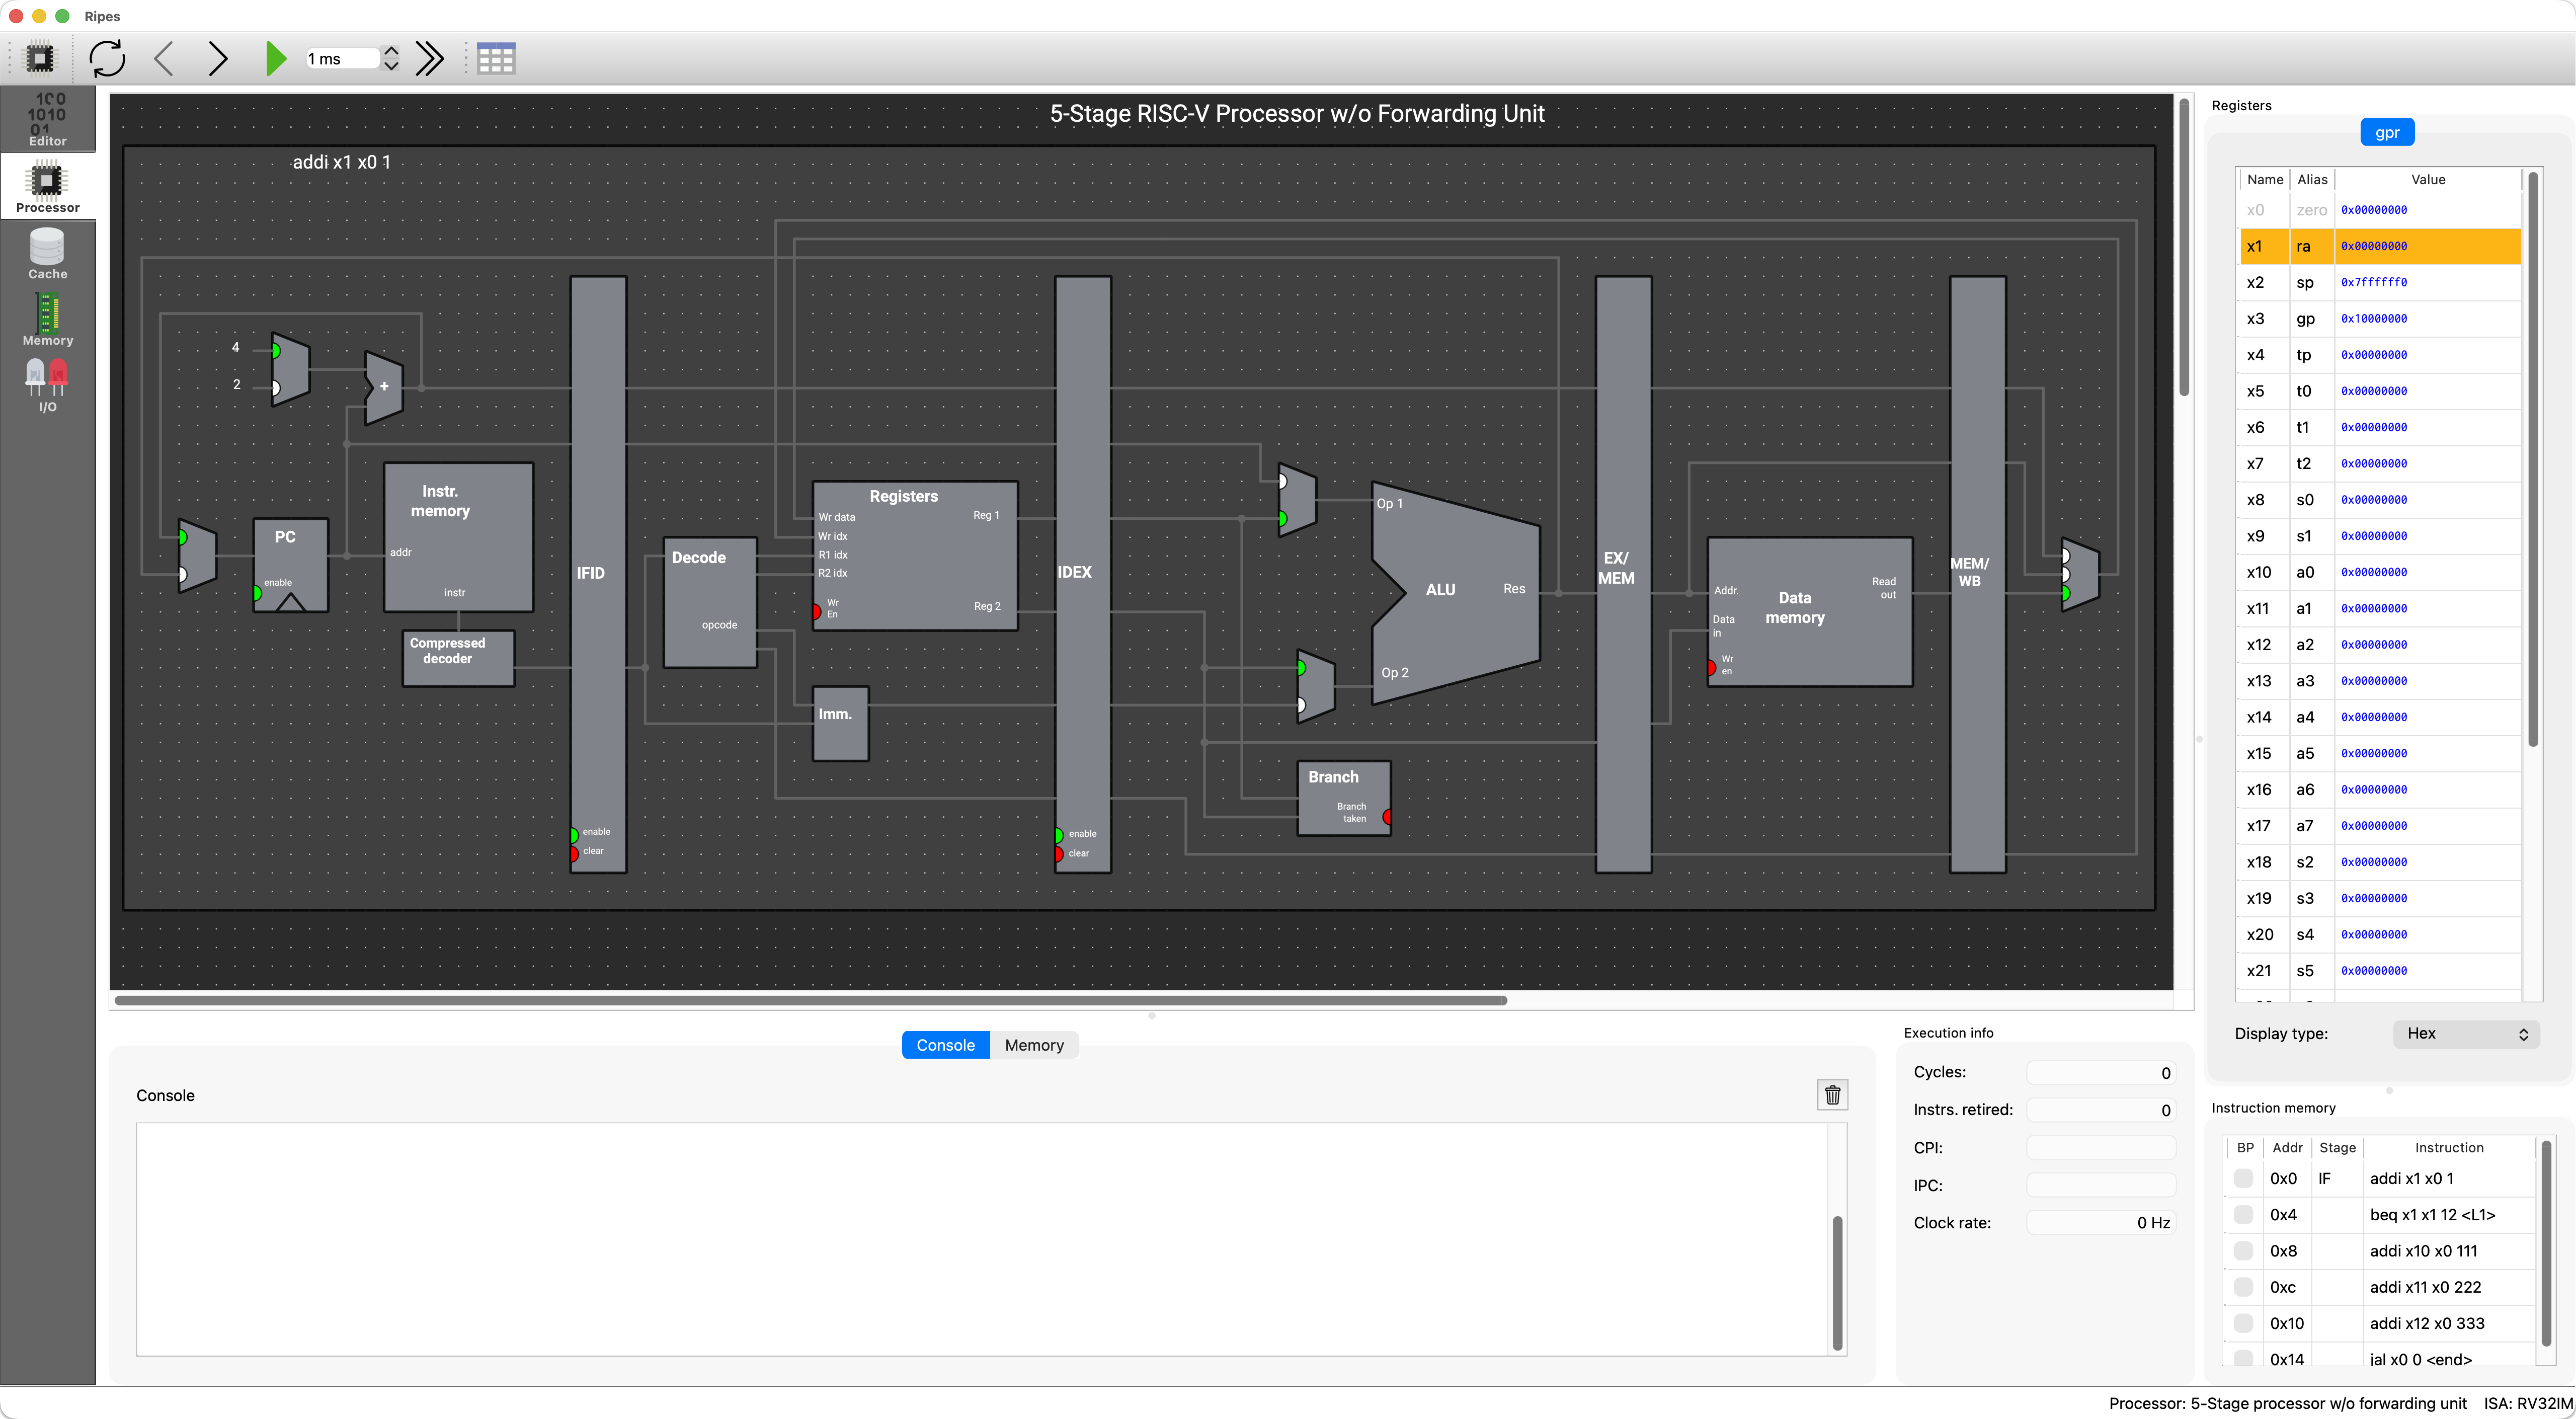
Figure 6.1: Ripes processor view.
Visual cues for signals and components
Section titled “Visual cues for signals and components”- MUX input highlight: the selected input is marked with a green dot, making control-driven dataflow easy to see.
- Wire state changes:
- 1-bit control wires: green = 1, gray = 0
- multi-bit buses: briefly flash green when updated
- Component state indicators: some blocks indicate whether they were written this cycle, whether a branch was taken, or whether a stage stalled/flushed.
Inspecting values and tracing paths
Section titled “Inspecting values and tracing paths”- Hover a port to see name and value.
- Click a wire to highlight the path.
- Enable Display signal values to show values next to ports (you can change radix via right-click).
Ripes supports zooming (Ctrl/Cmd + scroll). In the processor model selection dialog you can also choose an Extended layout to expose more internal signals.
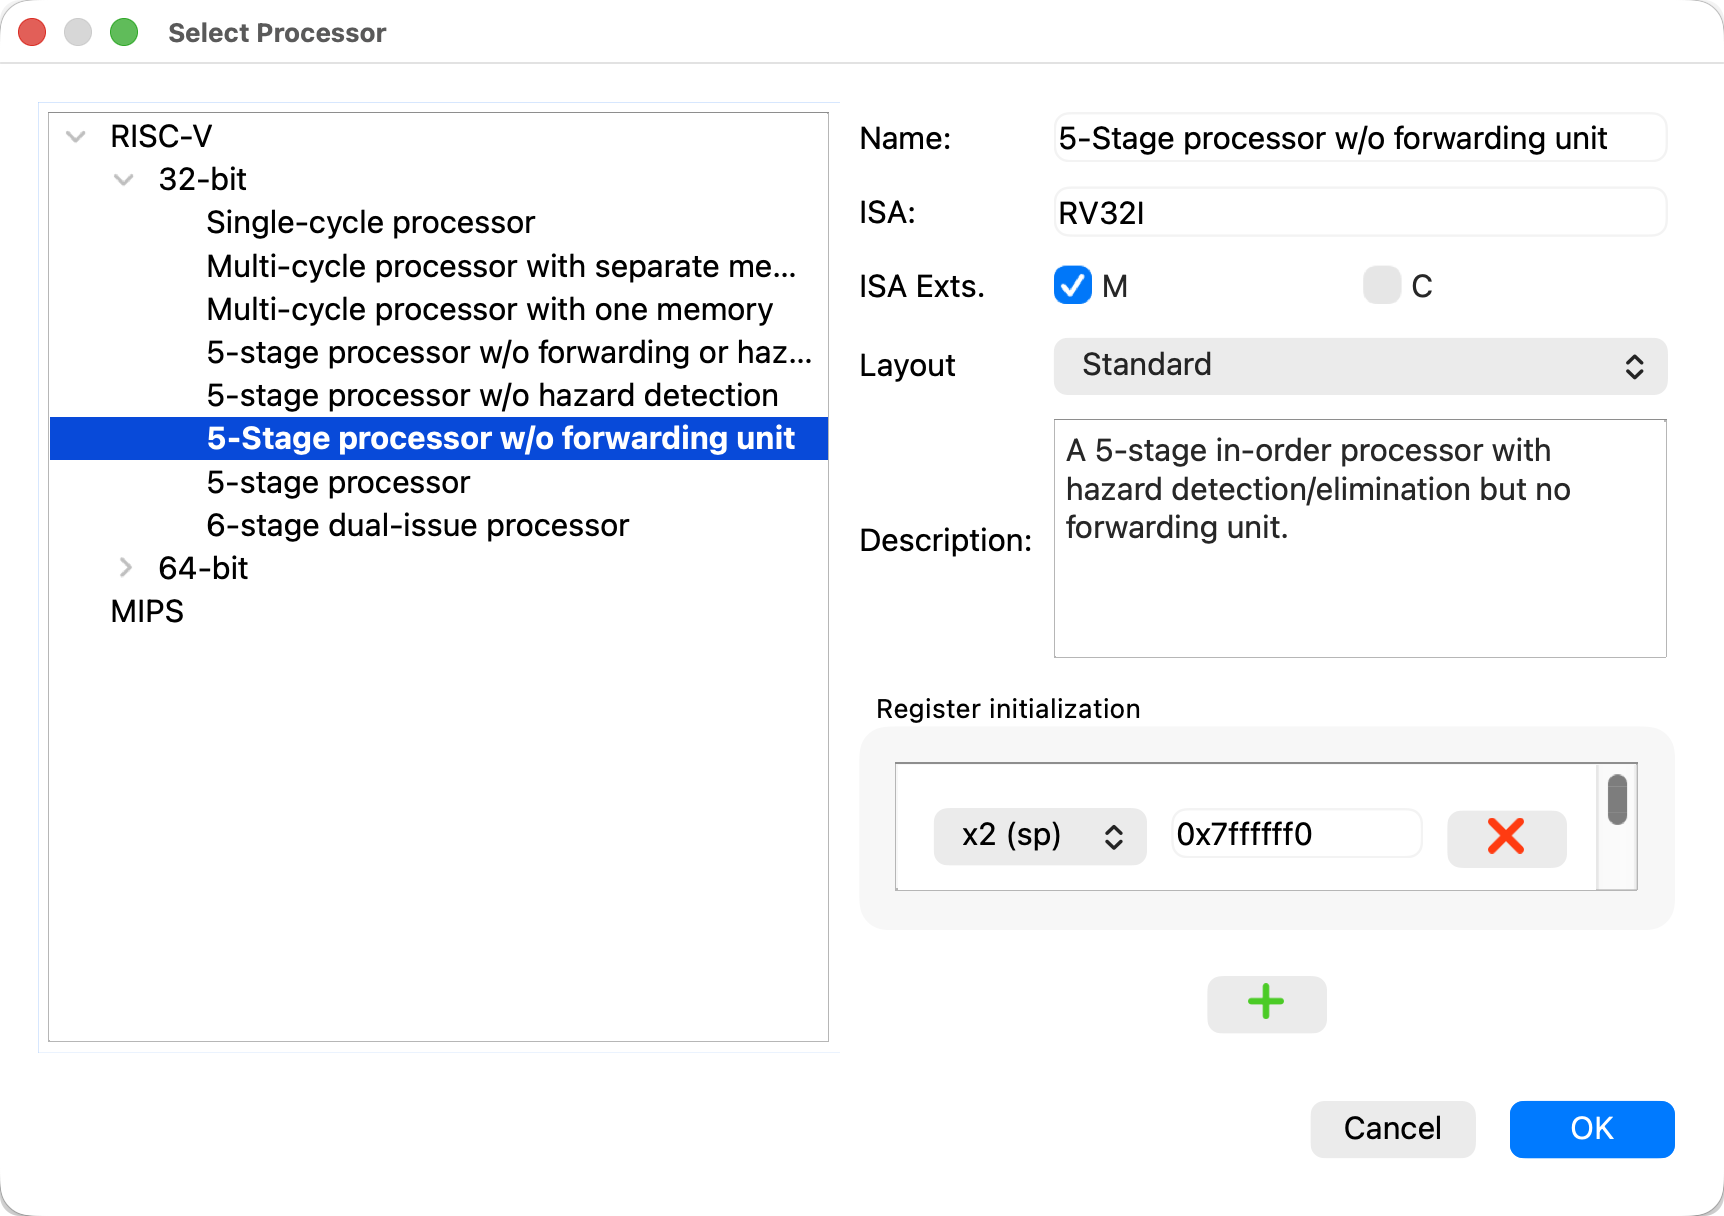
Figure 6.2: Processor model selection dialog (choose extended layout to show more signals).
Toolbar shortcuts
Section titled “Toolbar shortcuts”The processor view toolbar provides controls for execution and inspection:
| Button | Meaning |
|---|---|
| Select Processor | Choose processor model (single-cycle, 5-stage pipeline, etc.) |
| Reset | Reset PC and clear simulation state |
| Reverse | Step back one cycle |
| Clock | Advance one cycle |
| Auto-clock | Run cycle-by-cycle automatically at a chosen frequency |
| Run | Fast-run without updating the UI every cycle (good for functional runs) |
| Show stage table | Show the pipeline stage table (not generated when using Run) |
Table 6.1: Common Ripes toolbar actions (names may vary slightly by version).